Metrics
A vital part of a successful safety management system is developing measures of performance that enable us to assess how well we are doing at preventing injuries and illnesses. Metrics allow us to recognize trends within these measures of performance, and by identifying issues and understanding their origins, we can anticipate subsequent incidents and build a safer work environment for faculty, staff and students. To communicate this data, an array of metrics dashboards have been created using Tableau. This tool allows us to share findings and to assist varying levels of University administration in interpreting trends. Below are details of each dashboard and an explanation of the data contained within each. For a list of definitions, please refer to this spreadsheet.
Balanced Safety Scorecard Data
UND Balanced Safety Scorecard Dashboard
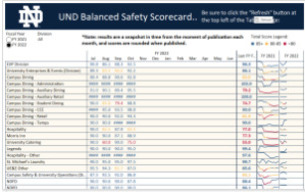
Provides performance measurement index that uses proactive (leading) and reactive (lagging) metrics to help support the advancement of the University's safety goals, each of which are weighted, resulting in an overall score ranging from 0 to 100. For further details, please refer to this spreadsheet. (Published monthly)
UND Balanced Safety Scorecard Dashboard
Action Items Dashboard
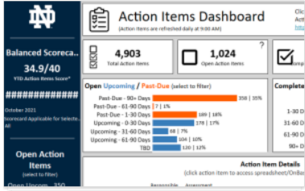
Provides a high-level breakdown of status and on-time completion percentages, as well as a detailed breakdown of assigned action items from safety assessments, incident investigations, machine shop assessments, and VPP gap assessments for all levels of the University. (Published daily at 11:00 am)
Incident Investigations Dashboard
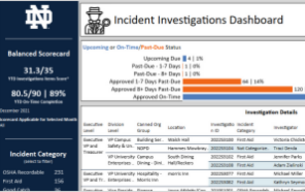
Provides a high-level breakdown of status and on-time completion percentages of assigned incident investigations for all levels of the University. (Published monthly)
Incident Investigations Dashboard
Routine Safety Inspections Dashboard
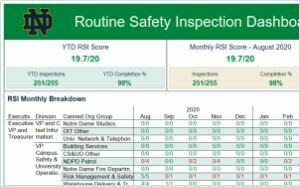
Provides a high-level breakdown by year-to-date and by month of Routine Safety Inspections completed, per the Departments' published schedules, as well as the points scored for the Balanced Safety Scorecard. (Published monthly)
Routine Safety Inspections Dashboard
Injury & Illness Data
UND Injury & Illness Dashboard
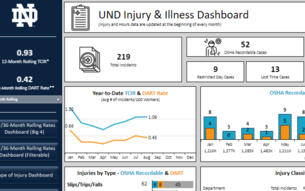
Provides a high-level breakdown of year-to-date Total Case Incident Rates (TCIR) and Days Away, Restricted Time, and Transfer Rates (DART), OSHA recordable injury and DART case counts, injury types, and a detailed breakdown of injuries by department for all levels of the University. (Published monthly)
UND Injury & Illness Dashboard
12-/36-Month Rolling Incident Rates Dashboard (University and Executive Levels)
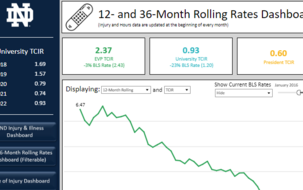
Provides 12- and 36-month rolling Total Case Incident Rates (TCIR) and Days Away, Restricted Time, and Transfer Rates (DART) for the University and its executive levels using data beginning in December 2012, as well as current BLS Rates for the University and Target Rates for the EVP. (Published monthly)
12-/36-Month Rolling Incident Rates Dashboard (University and Executive Levels)
12-/36-Month Rolling Rates Dashboard (Filterable)
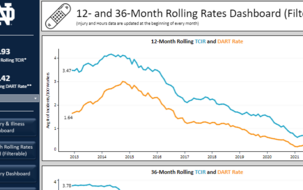
Provides the 12- and 36-month rolling OSHA Recordable Total Case Incident Rates (TCIR) and Days Away, Restricted Time, and Transfer Rates (DART) for all levels of the University. (Published monthly)
12-/36-Month Rolling Rates Dashboard (Filterable)